Same flow, different denominators
A modest share of California departures; a large New York origin
California’s table total is 661,205 people who lived in another state after living in California a year earlier. The New York cell is 4.7% of that total. New York received 285,304 people from other states; the California origin represents 11.0% of those arrivals.
From California
4.7%
Rank 7 of 50 outbound destinations.
Into New York
11.0%
Rank 2 of 48 inbound origins.
The percentages use different state totals; they should not be added together. For comparison, theCalifornia to Texas brief describes California’s largest outbound destination.
What a rank cannot prove
Oregon and New York are nearly tied by point estimate
California → Oregon
31,500
90% MOE ± 4,443
California → New York
31,367
90% MOE ± 4,875
Oregon sits just above New York in the ordered California list: their point estimates differ by 133 people. That gap is far smaller than either published 90% margin of error. The displayed sixth and seventh ranks identify the order of two estimates, not evidence that Oregon reliably drew more people.
The same caution applies looking into New York. New Jersey’s inbound estimate is 36,002 ± 5,753; California’s is 31,367 ± 4,875. New Jersey ranks first and California second by point estimate, but ranking alone is not a statistical test.
Across both coasts
The reverse flow and its uncertainty
New York to California is estimated at 24,927 ± 3,680 people. The point difference from the California to New York estimate is 6,440; the combined 90% margin of error used by the site is ± 6,108. That difference narrowly exceeds the comparison margin under the stated method; a single-year result should not be described as a lasting trend.
The California-to-New York estimate has a 90% interval of 26,492–36,242. These are survey estimates of previous residence for people age one and older, not shipment counts or forecasts.
For an actual move
Use addresses, not state centroids, to compare offers
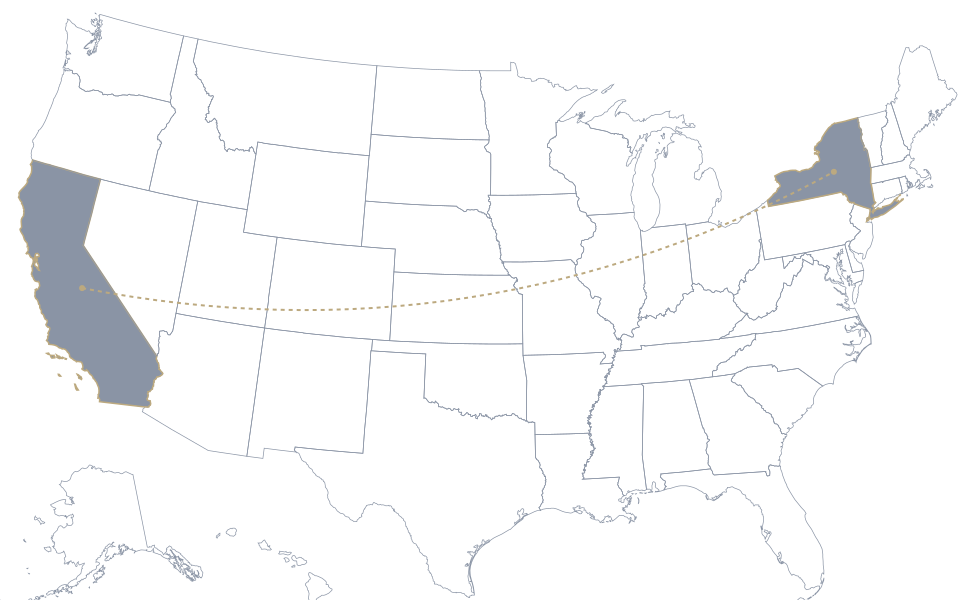
The map spans 2,332 straight-line miles between state centroids. It is not road distance between your pickup and delivery cities. Census T13 has no truck inventory, carrier tariff, tolls, delivery date or moving price. Get written offers for the same addresses and inventory, then check the companies and estimate terms.
Search a company
Citable statement
In the 2024 ACS 1-year Table T13, 31,367 New York residents reported living in California one year earlier (90% margin of error ± 4,875).
Source: U.S. Census Bureau, State-to-State Migration Flows, released 2026-01-21. The measure is previous residence, not a household-goods shipment. Read the comparison method.