Latest official migration data
State-to-state migration, ACS 2024
Tabulation of current state of residence crossed by state of residence 1 year ago. This is a 1-year mobility / previous-residence statistic, not a count of household-goods shipments.
2024 ACS 1-year · released Jan 21, 2026 · last checked Sep 7, 2026 · latest available. Totals below keep their 90% margins of error. The 2025 table has not been released; a newer net figure for each state, without pairs or margins, is under net domestic migration to July 2025.
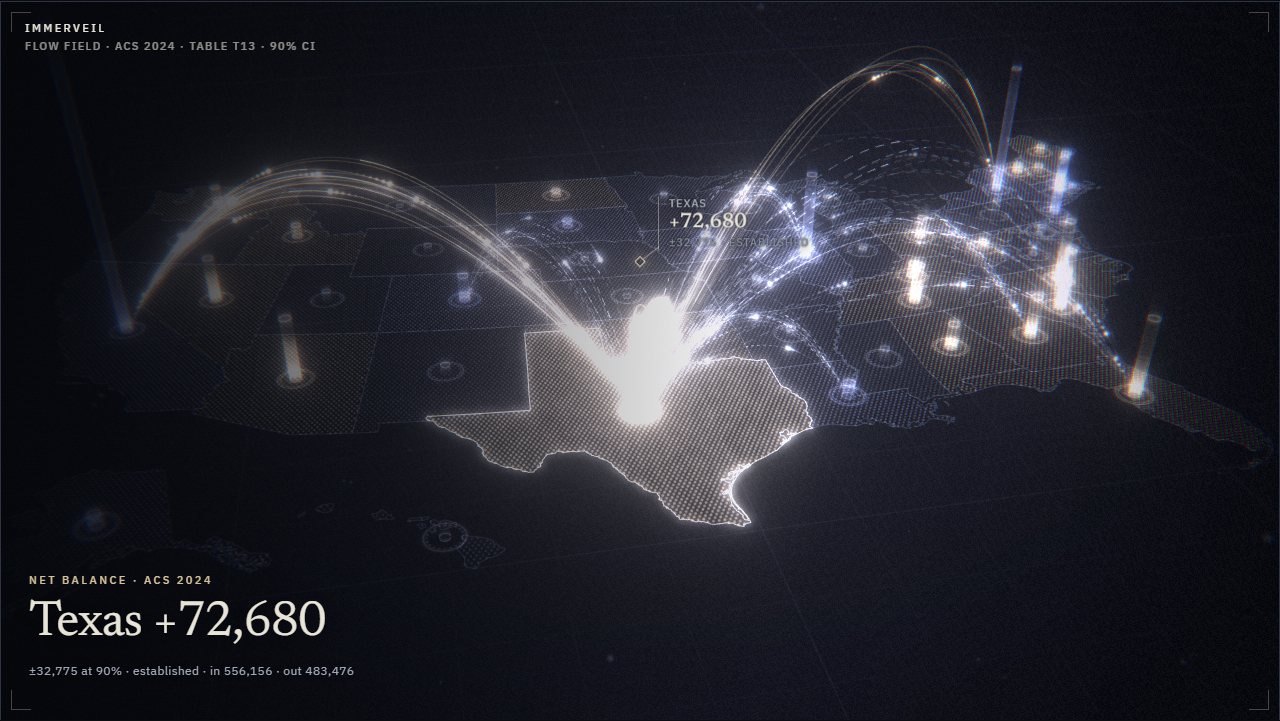
The table below lists every state's ACS balance and margin of error. The optional 3D view shows those figures as light columns and flow bundles.
The view draws the state-to-state table in three dimensions. A state's net balance, arrivals from other states minus departures to them, stands as a column of light only where it exceeds its 90% margin of error; where it does not, the state gets haze. The bundles of light are the largest state-to-state flows, 60 of them in the full view, and a bundle spreads as its margin of error grows. A short film plays first. After it, drag to turn the view and select a state to see its largest flows. The same balances are listed as text under Established net balances.
Citable statement
In ACS 2024, 7,157,607 people (± 75,154, 90% margin of error) lived in a different U.S. state than one year earlier, out of a population of 336,636,468 aged 1 and over.
- Source ·
- U.S. Census Bureau, State-to-State Migration Flows: 2024 American Community Survey 1-Year Estimates (Table T13). Official release Jan 21, 2026. Margins of error are 90% MOE.
- Status ·
- Latest available as of Sep 7, 2026. No 2025 state-to-state table is published.
- Limitation ·
- A previous-residence count of people, not household-goods shipments or permanent relocations. Movers from abroad are counted separately and are not in the state-to-state cells.
- Cite as ·
- YardPermit, “State-to-state migration, ACS 2024”, https://yardpermit.com/moving/data/migration — derived from U.S. Census Bureau ACS 2024 1-year Table T13.
National totals
- Population 1 year and over
- 336,636,468± 32,733
- Same residence as a year ago
- 297,038,514± 210,231
- Moved within their state
- 29,888,154± 189,075
- Moved from another state
- 7,157,607± 75,154
Read together: 88.2% of people aged 1 and over lived at the same address as a year earlier, 8.9% moved but stayed in their state, and 2.1% arrived from another state. People who lived abroad a year earlier (2,552,193) are a separate category and do not appear in any state-to-state cell. The four shares are YardPermit arithmetic on the published totals.
Established net balances
29 of 51 state balances are larger than their 90% margin of error. These are the columns of light in the view at the top of this page. The state index ranks all 51 with their inbound and outbound totals.
| State | Net balance | 90% margin |
|---|---|---|
| Texas | +72,680 | ± 32,775 |
| Florida | +67,630 | ± 34,929 |
| North Carolina | +58,587 | ± 21,252 |
| Arizona | +55,160 | ± 18,236 |
| South Carolina | +54,676 | ± 14,937 |
| Nevada | +41,278 | ± 13,986 |
| Georgia | +37,012 | ± 21,041 |
| Tennessee | +35,780 | ± 17,815 |
| Oklahoma | +33,900 | ± 10,346 |
| Alabama | +22,232 | ± 13,326 |
| Ohio | +20,315 | ± 15,629 |
| Washington | +17,707 | ± 15,947 |
| Kentucky | +13,230 | ± 10,414 |
| Idaho | +12,466 | ± 9,326 |
| Vermont | +9,137 | ± 4,614 |
| New Hampshire | +8,096 | ± 7,560 |
| Maine | +7,754 | ± 6,443 |
| West Virginia | +7,154 | ± 6,593 |
| North Dakota | +6,242 | ± 4,821 |
| South Dakota | −7,299 | ± 5,714 |
| Iowa | −9,683 | ± 7,869 |
| Alaska | −10,615 | ± 7,304 |
| Louisiana | −12,166 | ± 10,981 |
| Colorado | −24,205 | ± 17,168 |
| Massachusetts | −30,032 | ± 14,792 |
| New Jersey | −63,913 | ± 15,920 |
| Illinois | −82,470 | ± 17,588 |
| New York | −130,145 | ± 23,327 |
| California | −254,332 | ± 27,136 |
Inside the margin of error (22): Arkansas, Connecticut, Delaware, District of Columbia, Hawaii, Indiana, Kansas, Maryland, Michigan, Minnesota, Mississippi, Missouri, Montana, Nebraska, New Mexico, Oregon, Pennsylvania, Rhode Island, Utah, Virginia, Wisconsin, Wyoming. At 90% confidence, the survey does not establish whether these states gained or lost residents in their exchanges with other states in 2024.
Newer, with less detail: net domestic migration to July 2025
The state-to-state table above is the latest the Census Bureau has published; the 2025 table has not been released. A more recent but coarser figure exists: the Bureau's Vintage 2025 population estimates, released in January 2026, give each state one net domestic-migration number for July 1, 2024 to July 1, 2025. They come from a different method than the survey. They have no state-to-state pairs and no published margin of error, so they cannot be drawn in the view above, and the two sources should not be subtracted from each other.
Largest net gains
- North Carolina+84,064
- Texas+67,299
- South Carolina+66,622
- Tennessee+42,389
- Arizona+31,107
- Georgia+27,333
- Alabama+23,358
- Florida+22,517
Largest net losses
- California−229,077
- New York−137,586
- Illinois−40,017
- New Jersey−37,428
- Massachusetts−33,340
- Louisiana−14,387
- Maryland−12,127
- Colorado−12,100
Source: U.S. Census Bureau, Vintage 2025 population estimates, file NST-EST2025-ALLDATA, column DOMESTICMIG2025, all 51 states and DC (the figures sum to zero). Net domestic migration counts people moving between states only, not arrivals from abroad.
The largest two-way exchanges
Every pair of states has two cells in the table, one for each direction. Added together they show how much movement the pair shares; the gap between them shows which way it leans. Of the 1,275 pairs among the 50 states and the District of Columbia, 1,048 have both directions published. These are the twelve largest.
| Pair | Both directions | Larger direction | Other direction | Gap (± 90%) | Direction |
|---|---|---|---|---|---|
| California ⇄ Texas | 122,608 | → Texas 77,161 | 45,447 | 31,714 ± 11,232 | Established |
| Florida ⇄ Texas | 97,478 | → Texas 52,219 | 45,259 | 6,960 ± 14,925 | Inside the margin |
| New York ⇄ New Jersey | 92,801 | → New Jersey 56,799 | 36,002 | 20,797 ± 10,053 | Established |
| Florida ⇄ Georgia | 86,759 | → Georgia 52,371 | 34,388 | 17,983 ± 10,307 | Established |
| California ⇄ Arizona | 80,557 | → Arizona 52,383 | 28,174 | 24,209 ± 8,209 | Established |
| New York ⇄ Florida | 78,741 | → Florida 50,661 | 28,080 | 22,581 ± 8,349 | Established |
| California ⇄ Nevada | 74,422 | → Nevada 53,289 | 21,133 | 32,156 ± 8,377 | Established |
| California ⇄ Washington | 70,894 | → Washington 43,938 | 26,956 | 16,982 ± 7,360 | Established |
| New Jersey ⇄ Pennsylvania | 64,369 | → Pennsylvania 38,467 | 25,902 | 12,565 ± 6,153 | Established |
| North Carolina ⇄ South Carolina | 63,133 | → South Carolina 33,151 | 29,982 | 3,169 ± 7,284 | Inside the margin |
| Florida ⇄ North Carolina | 59,456 | → North Carolina 33,591 | 25,865 | 7,726 ± 7,385 | Established |
| Pennsylvania ⇄ Florida | 58,578 | → Florida 33,530 | 25,048 | 8,482 ± 10,253 | Inside the margin |
The 2nd largest exchange, Florida and Texas, involved 97,478 people, yet the 6,960-person gap between its directions is inside its margin of error (± 14,925). A large exchange does not by itself have a settled direction.
How often a pair's direction is settled
Across all 1,048 pairs, the gap between the two directions exceeds its margin of error in 212 (20.2%). 17 of the 29 exchanges of 40,000 or more people have an established direction; 100 of the 715 under 5,000 do.
| Both directions | Pairs | Established | Share |
|---|---|---|---|
| 40,000 or more | 29 | 17 | 58.6% |
| 20,000 to 39,999 | 63 | 30 | 47.6% |
| 10,000 to 19,999 | 92 | 24 | 26.1% |
| 5,000 to 9,999 | 149 | 41 | 27.5% |
| Under 5,000 | 715 | 100 | 14.0% |
Each pair is tested on its own at 90%. A pair whose two directions are truly equal would still pass about one time in ten, and 1,048 pairs are tested here, so some of the 212 are expected to be chance results. A single small pair that passes is weaker evidence than a large one.
What the table counts
The American Community Survey asks where each person lived one year ago. Table T13 tabulates the answer as a grid: current state of residence against state of residence a year earlier. A cell such as Texas from California counts people, of any age from 1 upward, who live in Texas now and lived in California then. It does not say when in the year they moved, whether they moved once or several times, whether a household or a single person moved, or whether anything was shipped. It is not a measure of moving-company activity.
How to read a margin of error
Published ACS margins of error are 90 percent margins of error. Estimate ± MOE is a 90 percent confidence interval. Standard error ≈ MOE / 1.645. A cell of 20,000 ± 8,000 means the survey supports any value between 12,000 and 28,000 at that confidence, so a difference of a few thousand between two such cells is not evidence of a difference at all. Wherever YardPermit compares two estimates, it computes the margin of error of the difference as the square root of the sum of the squared margins and reports whether the gap exceeds it.
How YardPermit uses the file
2,652 pairwise cells were ingested from the workbook by a one-time script; cells the Census Bureau marks as not available are kept as not available, never imputed. The 368 pairs that clear the publication gate are ranked in the largest state-to-state moves table, and every state has a hub with its inbound and outbound totals, national rank and net balance. The table is state-level only: no county, metro, city or ZIP figures are published from it.
When a newer table appears
The Census Bureau publishes this table once a year, and the 2024 vintage is the latest. A newer vintage is promoted only after it has been ingested and checked, and until then the site keeps saying 2024. No page estimates or projects a 2025 figure.
Reusing the view
Each state's view has its own address: add ?state= and the two-letter postal code, as in /data/migration?state=TX. A 1280×720 still of every state's view is published under /moving/press/flow-field/ with the state's name, for example texas.jpg or new-york.jpg.

The Census table is a federal government work. YardPermit's view, stills, selection, calculations and explanatory text are offered under CC BY 4.0; credit YardPermit and the Census Bureau separately, link this page or the state's view, and keep the data year and the 90% margins of error when reusing a figure. This license does not imply Census endorsement.